Quickstart
Time: 10 minutes
preqc-lr generates a PDF report containing several plots such as estimated genome size and coverage. This report can be used to evaluate the quality of your sequencing data. Here, we provide a step-by-step tutorial to get you started!
Requirements:
Download example dataset
You can download the example dataset we will use here:
wget http://s3.climb.ac.uk/nanopolish_tutorial/preqclr_example_data.tar.gz
tar -xf preqclr_example_data.tar.gz
cd example_data/
Details:
This dataset from an E. coli sample were produced using Oxford Nanopore Technologies (ONT) MinION sequencer.
- Sample : E. coli str. K-12 substr. MG1655
- Instrument : ONT MinION sequencing R9.4 chemistry
- Basecaller : Albacore v2.0.1
- Number of reads: 63931
Generate overlap information with minimap2
We use minimap2 to find overlaps between our ONT long reads:
minimap2 -x ava-ont albacore_v2.0.1-merged.fasta albacore_v2.0.1-merged.fasta > overlaps.paf
If we take a peek at the first few lines of the Pairwise mApping Format (PAF) file, we see the following:
7fd051aa-c88b-4cf7-8846-cc2117780be2_Basecall_1D_template  6605    118     6425    -       ae8fc44b-ee05-4c7a-a611-483bb408cb9e_Basecall_1D_template       7834    629     7230    24806671        0       tp:A:S  cm:i:387        s1:i:2413       dv:f:0.1144
7fd051aa-c88b-4cf7-8846-cc2117780be2_Basecall_1D_template  6605    343     6417    -       cecc6ee9-f1ec-4c82-915a-5312f39f7ec5_Basecall_1D_template       6762    421     6710    24286372        0       tp:A:S  cm:i:370        s1:i:2374       dv:f:0.1149
7fd051aa-c88b-4cf7-8846-cc2117780be2_Basecall_1D_template  6605    118     6377    -       c0d8087f-ad9f-430c-8094-24c6187bed6c_Basecall_1D_template       11415   3039    9493    22646559        0       tp:A:S  cm:i:346        s1:i:2209       dv:f:0.1214
7fd051aa-c88b-4cf7-8846-cc2117780be2_Basecall_1D_template  6605    738     6422    -       bbb93738-16ec-4bcd-86e5-31e852946a7d_Basecall_1D_template       6596    553     6498    20916000        0       tp:A:S  cm:i:302        s1:i:2031       dv:f:0.1242
7fd051aa-c88b-4cf7-8846-cc2117780be2_Basecall_1D_template  6605    212     6422    -       943b8d89-2ee5-4d67-91d1-a94772afed31_Basecall_1D_template       7324    807     7152    20676448        0       tp:A:S  cm:i:322        s1:i:2011       dv:f:0.1255
You can find more information about the format of the PAF file here.
Generate assembly graph with miniasm
We use miniasm to get an assembly graph in the Graphical Fragment Assembly format:
miniasm -f albacore_v2.0.1-merged.fasta overlaps.paf > layout.gfa
Note
Make sure layout.gfa and overlaps.paf are not empty before continuing.
Perform calculations
We now have the necessary files to run preqc-lr (albacore_v2.0.1-merged.fasta, overlaps.paf, and layout.gfa).
To generate the data needed for the report we first run preqc-lr-calculate
./preqclr \
    --reads albacore_v2.0.1-merged.fasta \
    --sample_name ecoli.ONT \
    --paf overlaps.paf \
    --gfa layout.gfa \
    --verbose
This will produce a JSON formatted file (ecoli.ONT.preqclr) and a log of calculations that were performed (ecoli.ONT_preqclr-calculate.log).
Generate report
Now we are ready to run preqclr-report to generate a PDF file describing quality metrics of the sequencing data:
python preqclr-report.py \
    -i ecoli.ONT.preqclr --verbose
This will produce a PDF file: ecoli.ONT.pdf.
Example report
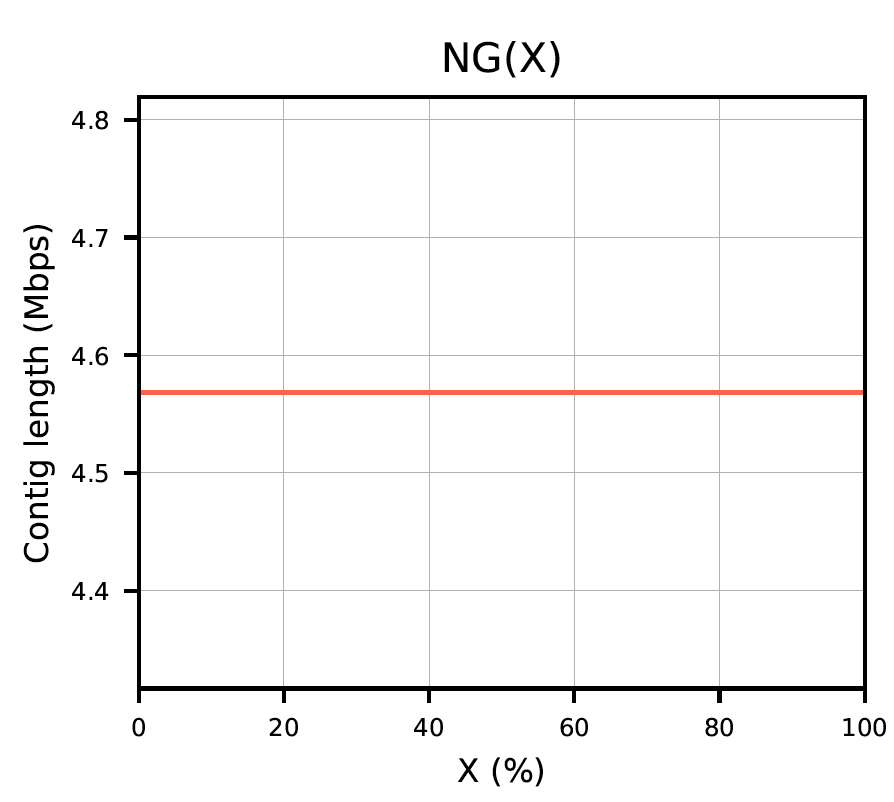
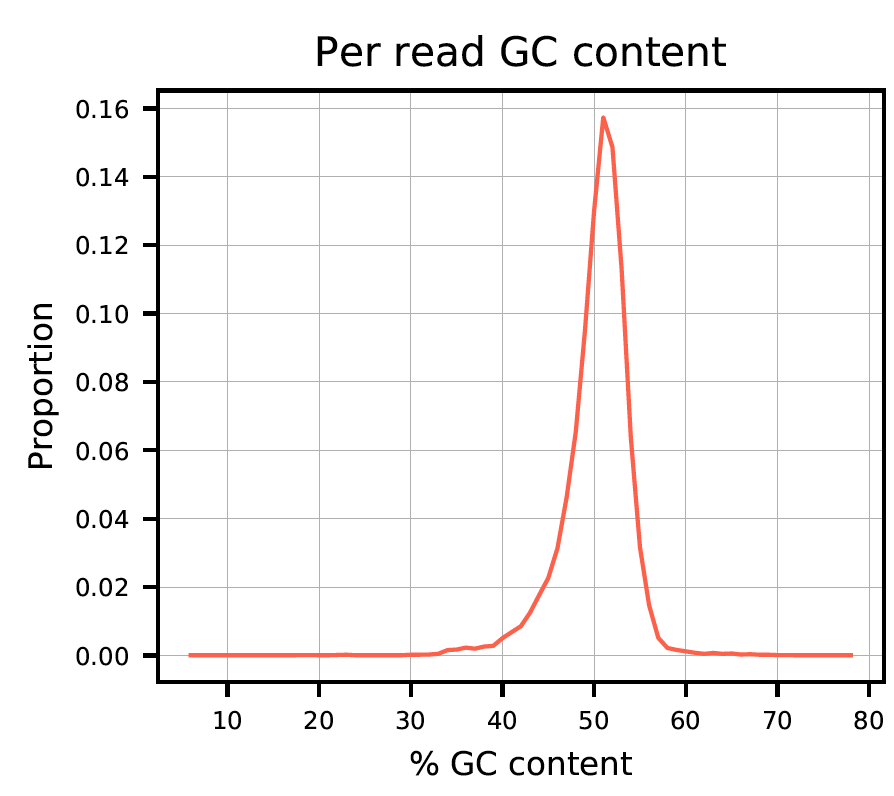
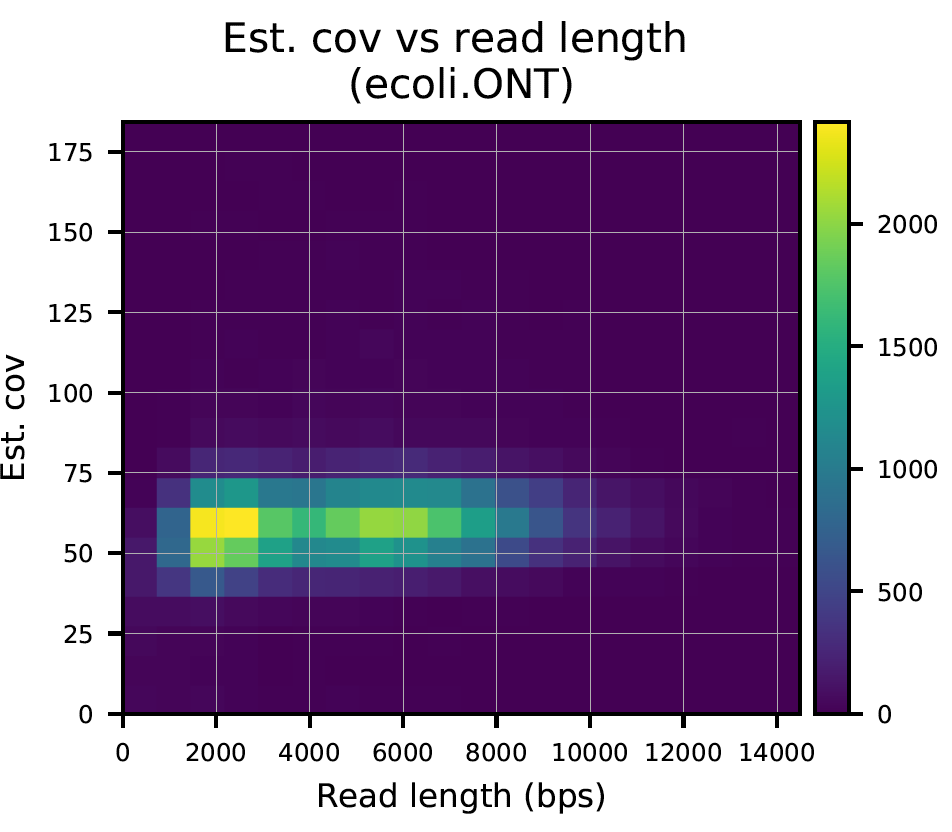
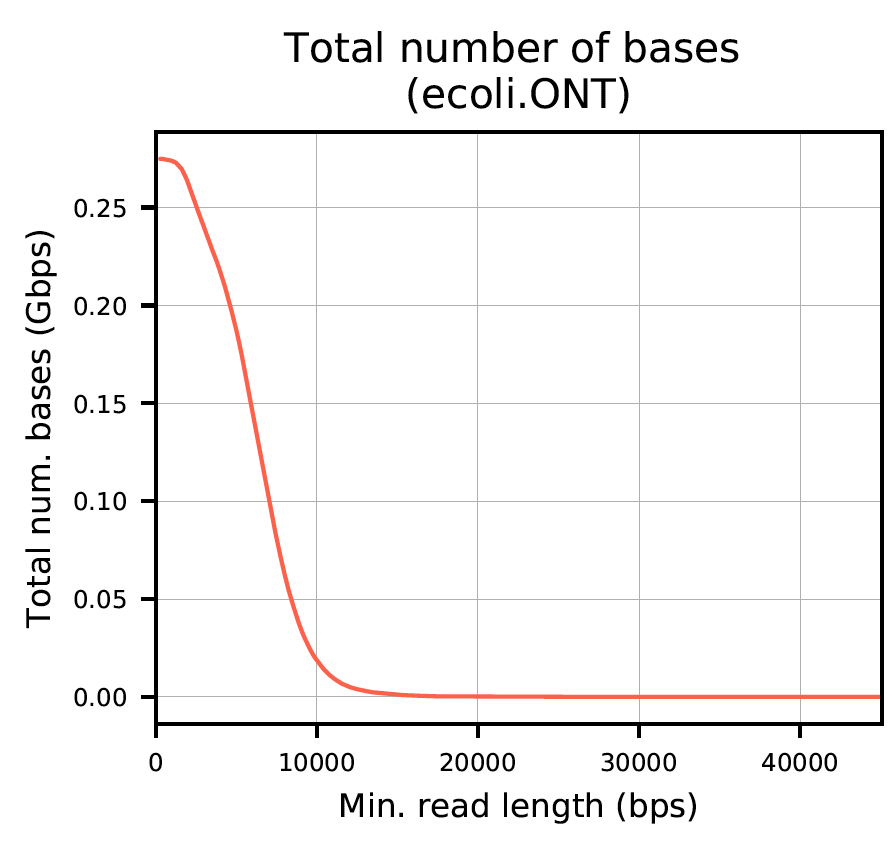
The report produces plots as seen below.
Plot 0:
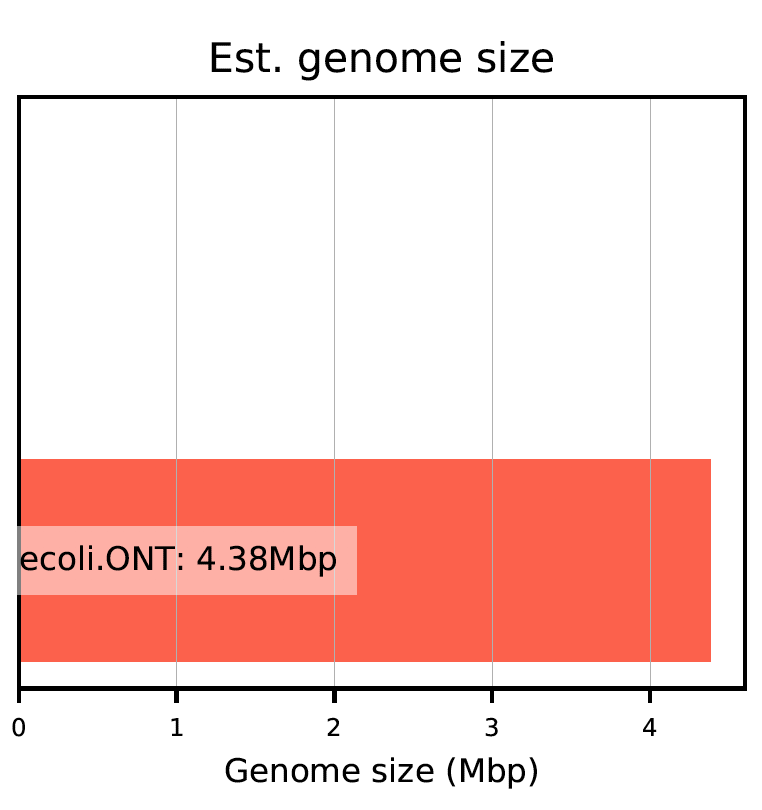
Plot 1:
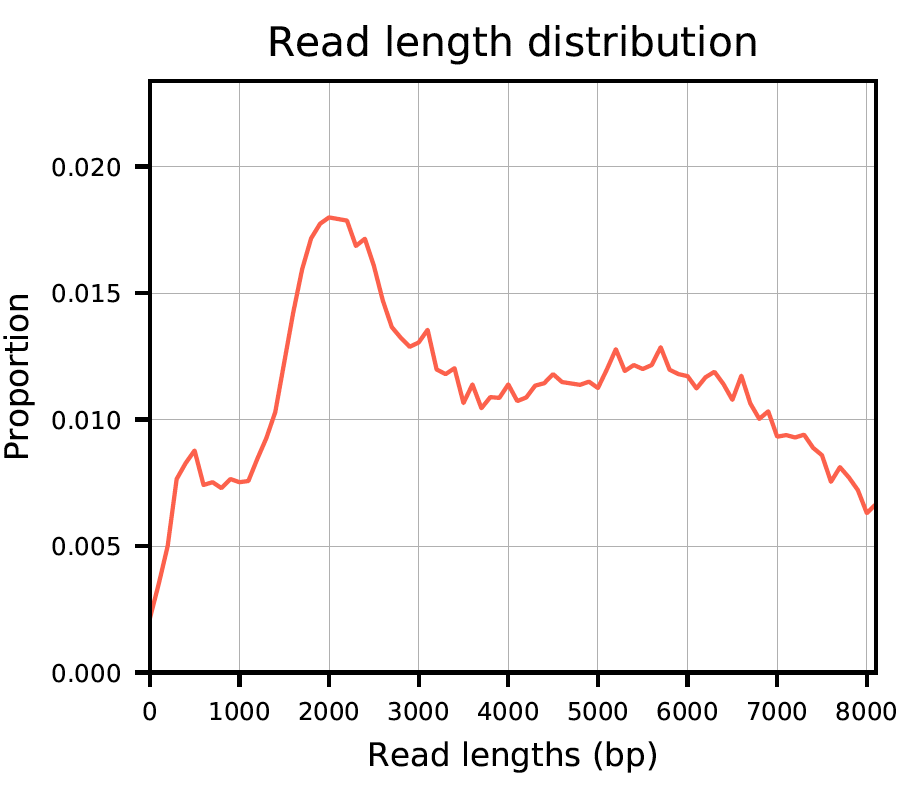
Plot 2:
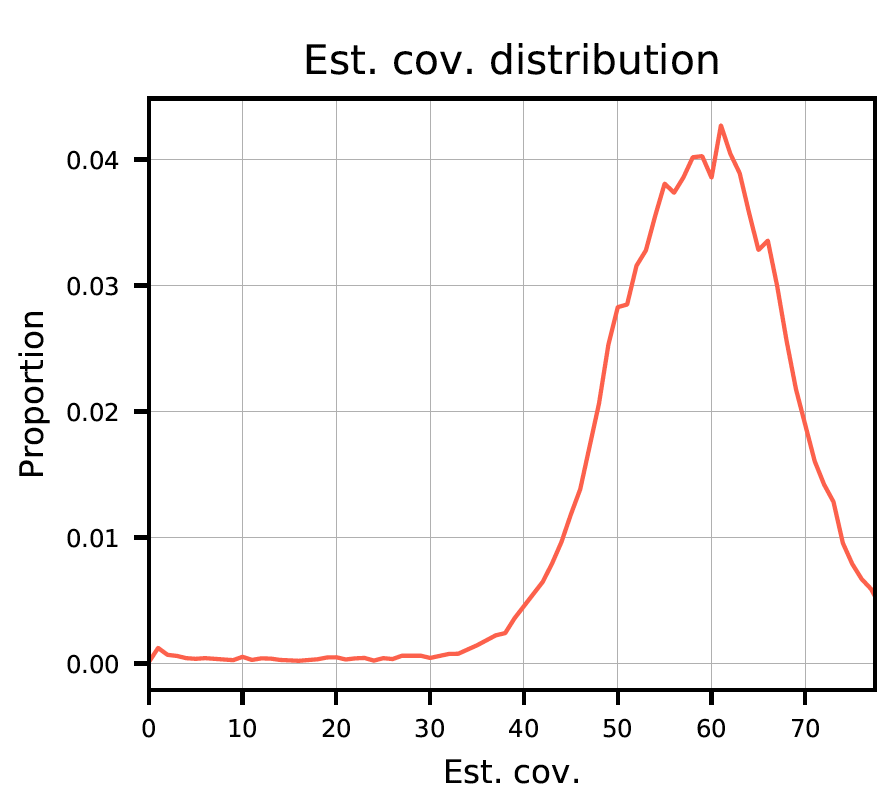
Plot 3:
Plot 4:
Plot 5:
Plot 6: